NeuralMesh Observe: Visibility and Control for Your WEKA Environment
Since our launch, we’ve been working with customers using NeuralMesh Observe to gain visibility across their WEKA environments on-premises, in public clouds, and in AI cloud deployments. Teams are using Observe’s dashboards, diagnostics, and alerting capabilities to answer critical operational questions: Am I getting the performance I expect? What’s happening when something needs attention? What’s running across my estate?
Observe provides answers to these questions and delivers professional, SaaS-based observability with modern dashboards, comprehensive multi-cluster visibility, and intelligent alerting. With Observe, you can validate infrastructure performance across all your clusters, diagnose issues independently with client-level diagnostics, and maintain complete visibility over your WEKA estate—servers, drives, file systems, S3 buckets, capacity, and health—all from a single interface.
This post walks through how customers are using Observe to validate performance, troubleshoot independently, and manage their infrastructure with confidence.
The Overview Dashboard
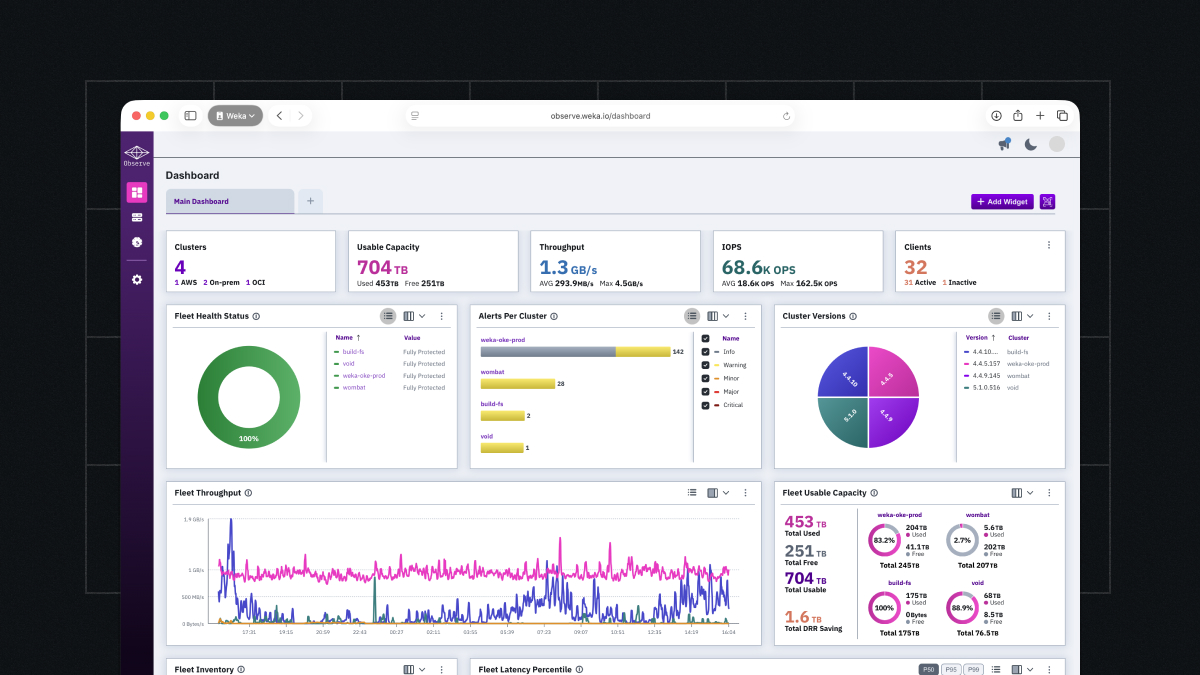
When you open Observe, the overview dashboard is your starting point. This view gives you visibility across all your WEKA clusters. You can see cluster health, throughput, latency, and capacity for your entire WEKA estate in one view.
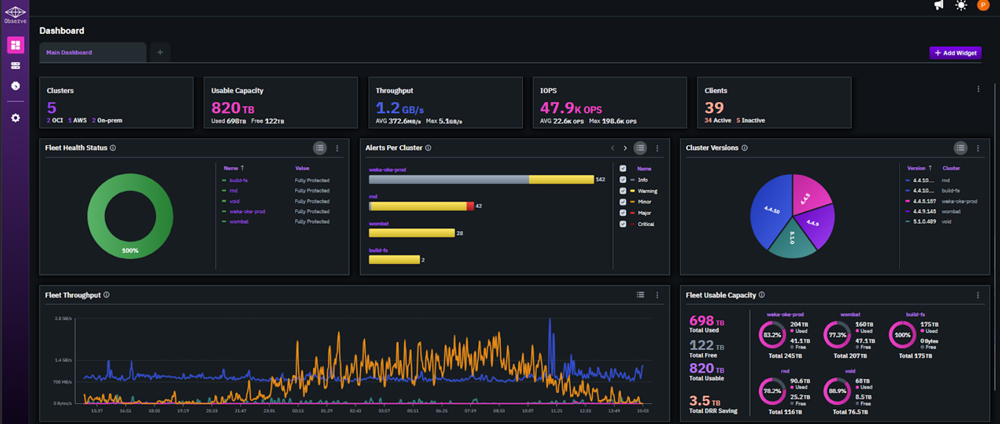
Overview Dashboard Screen
The Overview Dashboard Screen shows your clusters, usable capacity, throughput, IOPS, clients, and a variety of fleet-level statistics. The dashboard is fully customizable. You can add, remove, and rearrange panels to surface the metrics most relevant to your environment and team.
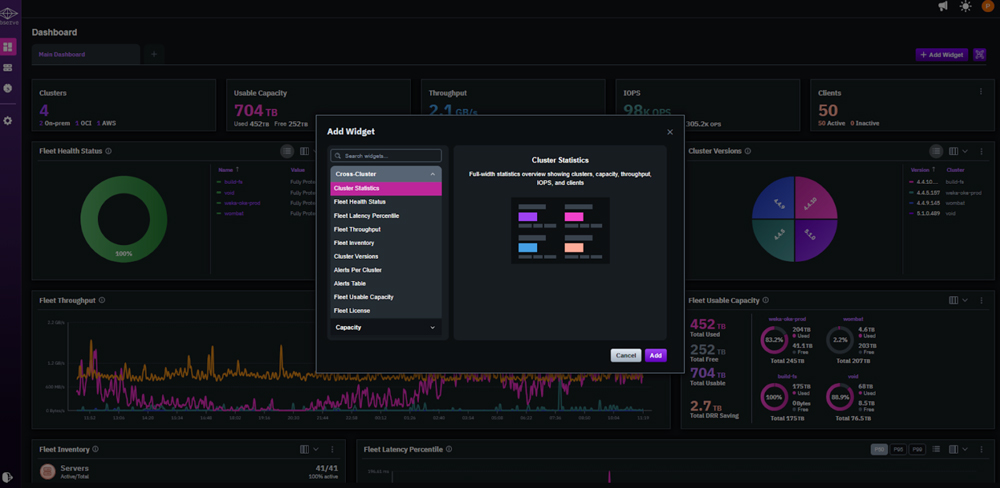
Dashboard Customization Panel
Once configured, the layout persists, so every time you open Observe, you’re looking at exactly what matters to you.
Performance Metrics
The performance view gives you a detailed look at throughput, latency, and IOPS across your WEKA clusters over time.
An extremely cool feature is hover sync. When you hover over any point on a performance chart, all other charts on the page sync to the same timestamp — making it straightforward to correlate metrics across dimensions without manually aligning timeframes.
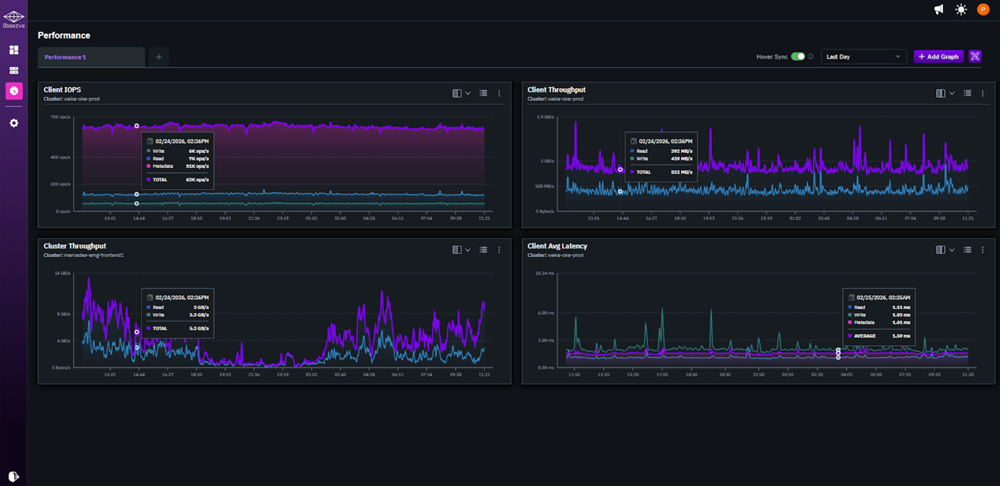
Performance Metrics With Hover Sync
This level of performance visibility helps you answer critical operational questions: Is my cluster delivering expected throughput? Where are my latency spikes coming from? Which file systems or clients are consuming resources? With Observe, you get the data you need to validate your WEKA investment and troubleshoot proactively without waiting for issues to escalate.
Single Cluster Dashboard
Selecting any cluster from the overview takes you into the single cluster dashboard — a dedicated view of that cluster’s performance, capacity, and health.
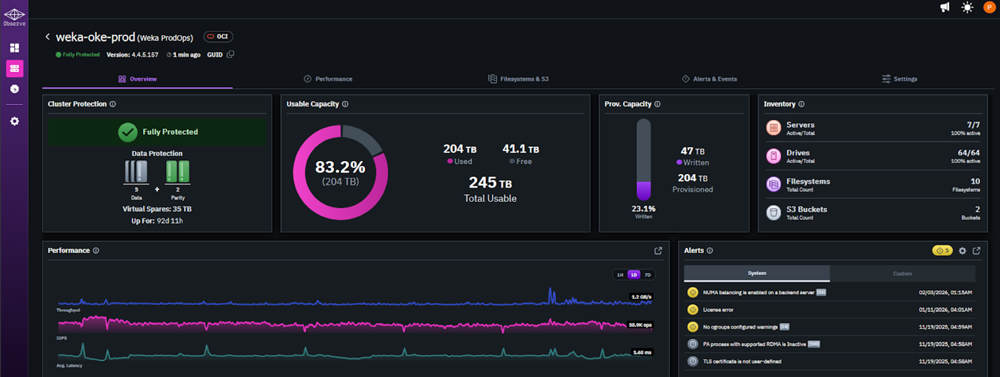
Single Cluster Dashboard Screen
The Single Cluster Dashboard Screen shows cluster protection, usable capacity, provisioned capacity, performance, and inventory in a single view. The metrics here follow the same layout as the overview, scoped entirely to the selected cluster. You get the same hover sync behavior across charts, so correlating activity within a cluster is just as fast as at the environment level.
Smart Alerting and Notifications
Within the single cluster dashboard, the Alerts panel surfaces active notifications alongside your performance and capacity data. Observe monitors your environment continuously and fires notifications when conditions cross defined thresholds. These alerts are then displayed directly in the interface or routed to your preferred notification channel.

Active Alerts Screen
Alert configuration lets you set thresholds at the cluster or node level, with options to tune sensitivity to match your environment’s normal operating range. This reduces noise and keeps your team focused on signals that actually require attention.
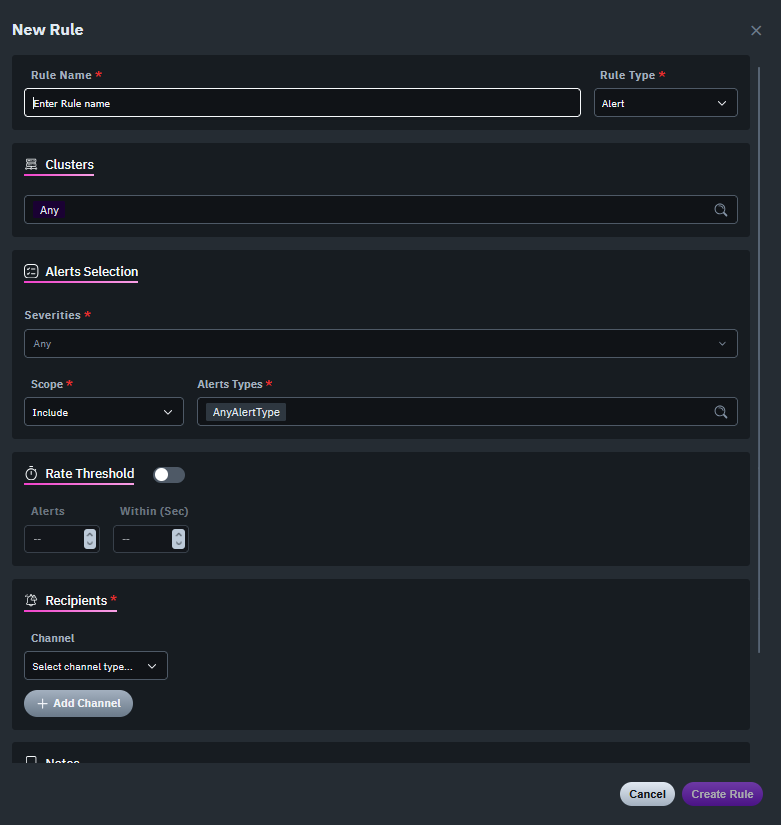
Alert Configuration Screen
For teams managing WEKA at scale, proactive alerting means you are notified when thresholds are breached immediately—not discovering issues after users complain. You can set alerts for performance degradation, capacity limits, or system health, then route notifications to Slack, PagerDuty, or via email with direct links back to relevant dashboards. This reduces time to resolution and gives you the option to troubleshoot independently or escalate to WEKA’s customer success team with better context and data.
Inventory
The multi-cluster dashboard also includes an Inventory panel with a complete picture of that cluster: every node and client — along with software version, connection status, and health.
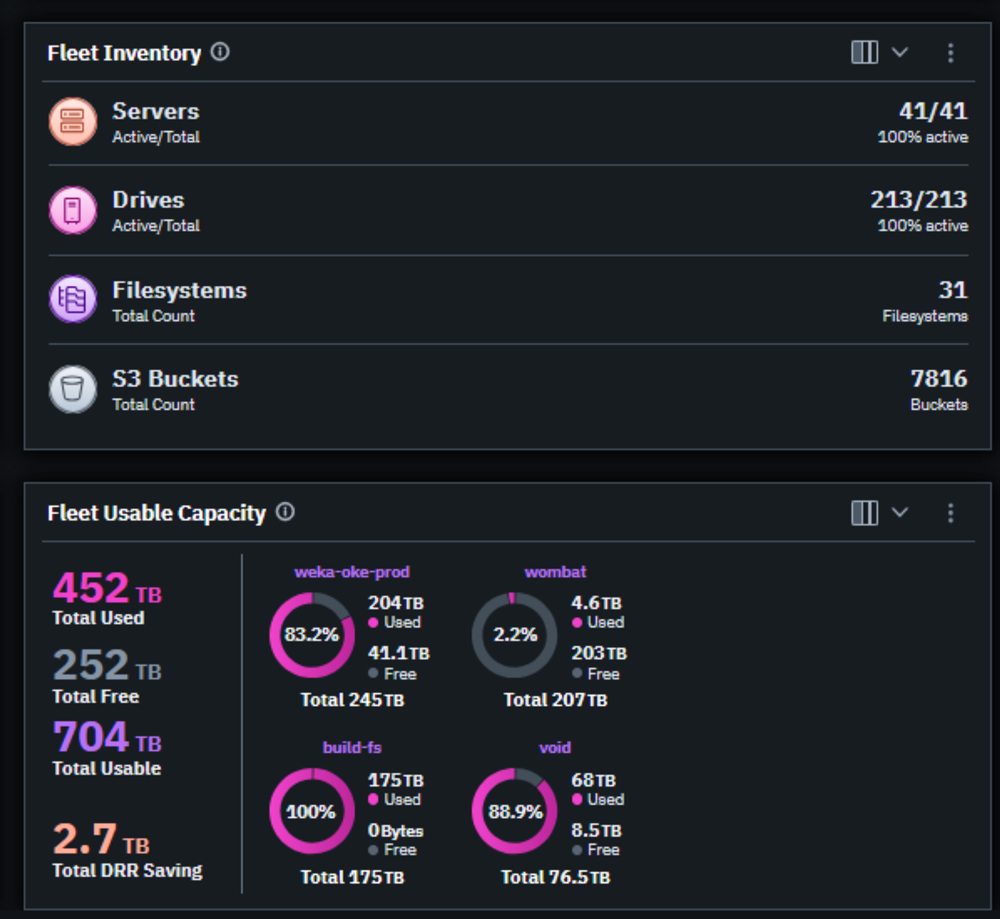
Inventory Screen
For teams managing multiple clusters or large deployments, this is the fast path to confirming what’s running, what’s connected, and what needs attention — without pulling logs or opening a support ticket. You get immediate visibility into your complete WEKA footprint, making capacity planning and version management straightforward.
NeuralMesh Observe is included with your WEKA deployment and is available now. If you’re an existing customer, you can access Observe through the support portal. If you’re new to WEKA and want to see how Observe delivers visibility for high-performance AI infrastructure, contact your WEKA account team for a walk through.
We will continue to expand Observe with advanced capacity planning, dynamic performance baselines, and enhanced analytics. Stay tuned for future posts diving deeper into specific workflows—including alerting strategies, integration with centralized observability platforms via Prometheus, and troubleshooting techniques using client-level diagnostics.
For now, we’re excited to put comprehensive observability in the hands of every WEKA customer—helping you validate performance, troubleshoot independently, and manage your infrastructure with confidence.
Popular Blogs From Phil Curran
Related Assets
-
The NAND Flash Shortage Survival Guide

The NAND Flash Shortage Survival Guide
-
Practical Strategies for Navigating the Memory Shortage

Practical Strategies for Navigating the Memory Shortage
-
The AI Factory Blueprint: Designing for Scalable, Efficient Inference
The AI Factory Blueprint: Designing for Scalable, Efficient Inference