
Trusted in Production By


The Inference Economy Runs on WEKA
WEKA NeuralMesh combines storage and memory on one platform. GPUs stay fed, memory persists, and the economics finally make sense.
6.5x Higher Token Throughput
“With WEKA, we can engineer out obsolescence. We can take an existing GPU-based system and bring it to market ready for the next generation of workloads.”
Read the Full StoryJust Shipped: News & Announcements

WEKA Debuts NeuralMesh 6 to Power Enterprise and Agentic AI Workloads at Production Scale
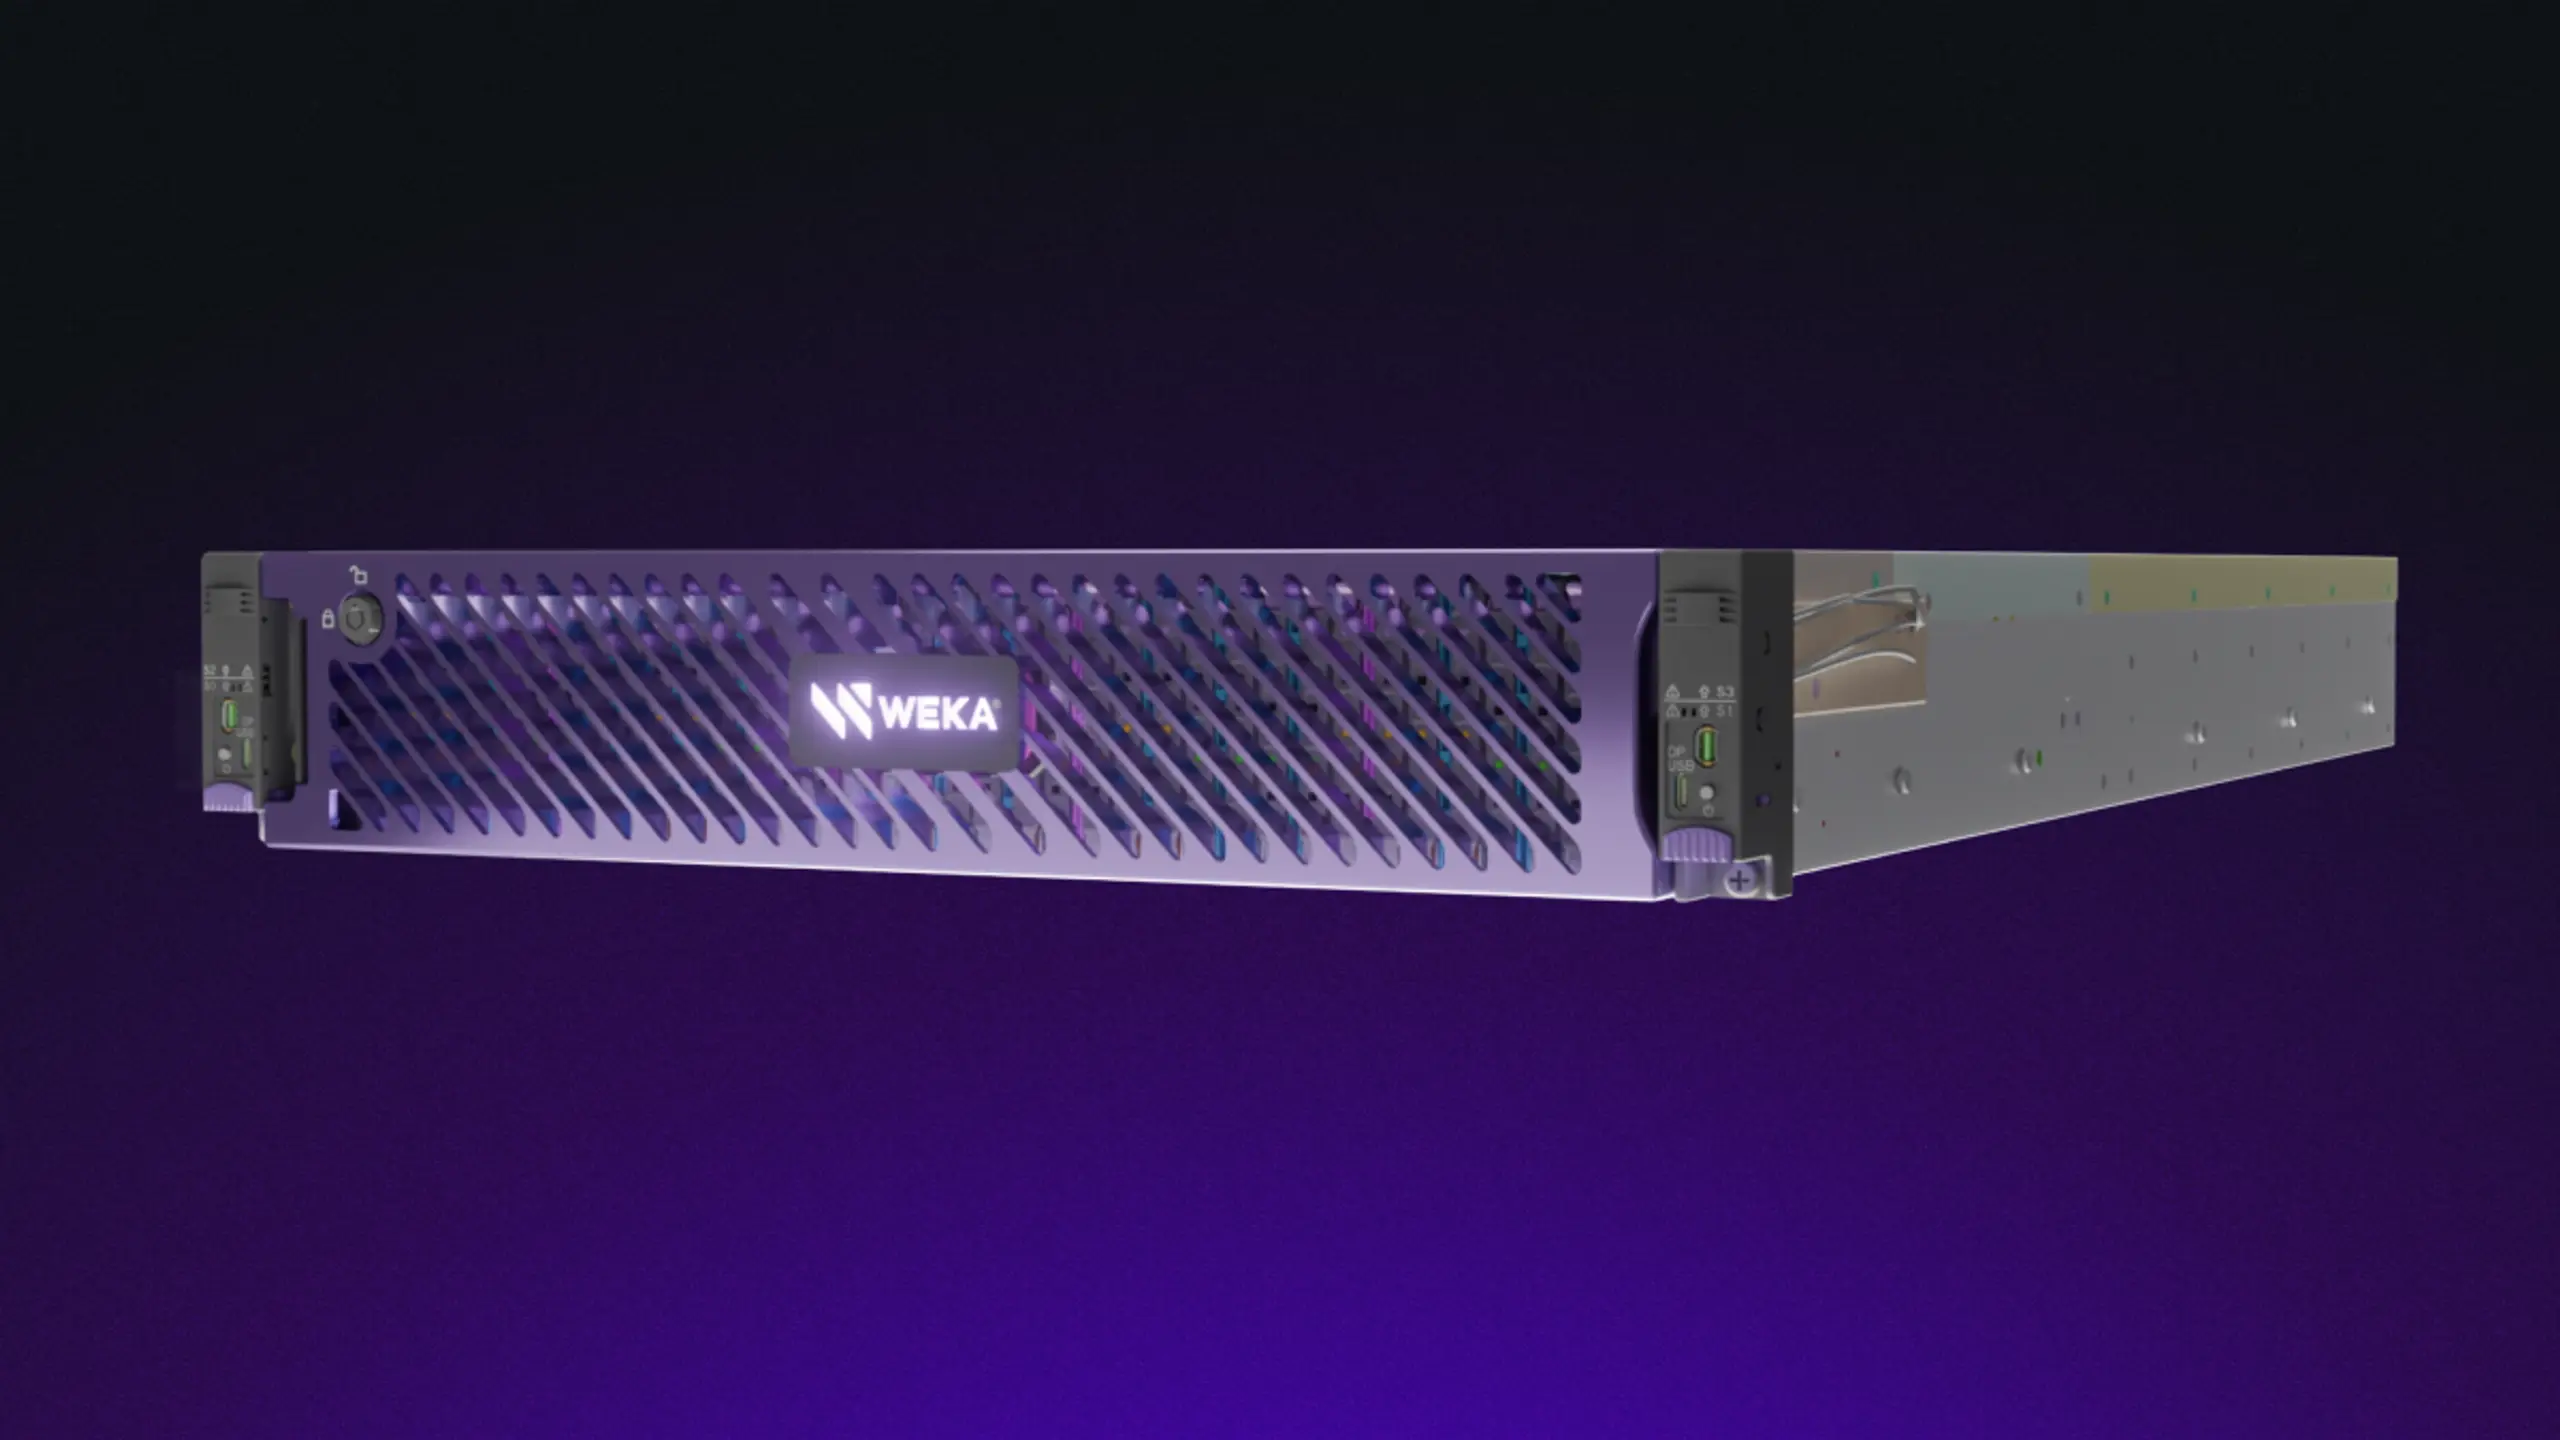
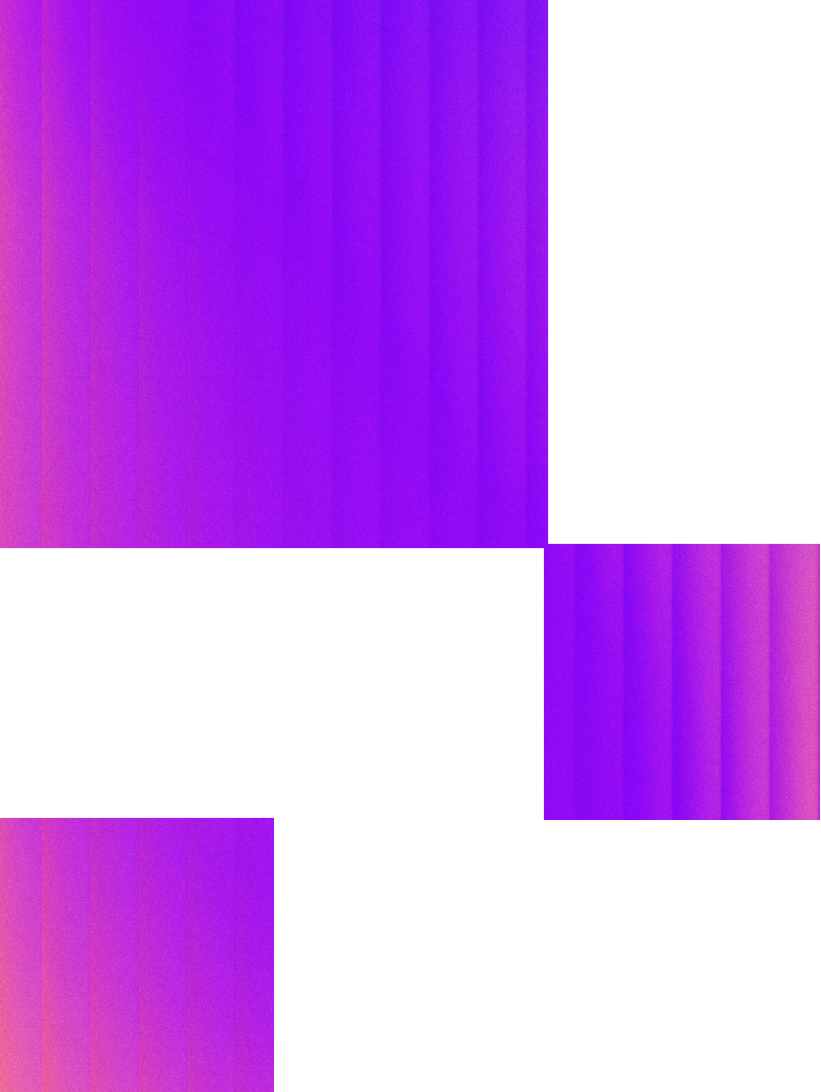
WEKA Unveils WEKApod 3: The World's Densest AI Storage and Memory System for Agentic Workloads

The Inference Economy Is Here. Your Infrastructure Wasn't Built for It.
When Everything Is Scarce, Density Is the Only Lever You Have